Still as true as it was when presented to us in formative days by SchoolHouse Rock: “Knowledge is power!”
But what if you can’t understand those scary, long reports full of numbers called financial statements? Income Statements, Profit and Loss, and Statement of Operations (hint: they’re all the same thing) reports? And don’t even get us started on the Balance Sheet! Ugh! Numbers are not your thing, right? That is what your accountant is for. However, even with an accountant or software generating perfectly accurate financial reports, they are just a lot of stale numbers if you don’t know how to dig in to them!
We at Sweeten CPA have developed a system to bridge the chasm between financial reports and key conclusions they can provide. We call it “The Dashboard.” (Think of all the key indicators on the dashboard of your vehicle that help you drive correctly.) When we provide your company with its own personalized Dashboard, one of our CPAs will sit and consult with you as as your honorary CFO. The CPA will point out and explain the measurements and ratios that mean the most for your business and industry, and exactly what they mean for your company. Some of these metrics will come from the data available in your accounting software or financial reports; some of it may come from outside sources.
Want proof that The Dashboard can benefit your company?
Do you know exactly how effective your different marketing techniques are? Do you know how profitable different types of products and service lines you offer are? Or which jobs are the most profitable? Do you know when it is more beneficial to buy or rent equipment? Do you know how profitable each employee is or when the breakeven for a new employee is? Have you tracked cash flow patterns to fend off possible future shortages? Do you have a 5 year projection and future growth plan for your company?
If you know the answer to all these types questions for your company, we give you major snaps! But if you don’t (because you are busy with things, like, growing and operating your business!) but would LIKE to, let us prepare a Dashboard tailored just for your company. Just like the dashboard in your car, let us turn your company’s raw data into clear and understandable indicators and tools that will help you safely and effectively drive your company to its bright future.

Are there patterns in your monthly cash flow? This can help you decide when to make or avoid large expenditures.
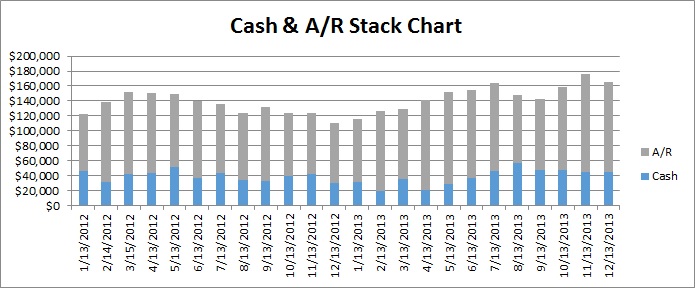
How much of your cash is tied up in receivables? Is it an acceptable amount?

What are your largest revenue generating items? Also to go one step further, are there any items that aren’t worth offering, ie, they cost more than they are bringing in?

How much of your net worth is liquid cash versus tied up in assets? Are there any trends to be aware of?
